How many babies were born during the 2024 eclipse?
I was privileged enough to see the 2024 total eclipse. I watched it in a clearing in dry west Texas, surrounded by awed humans, most of whom, like me, had roadtripped from far away for the glorious event. The trip deserves its own post, but for the meantime, here’s a short little calculational anecdote.
Some time after totality, while discussing the number of marriages during the eclipse, someone wondered: how many babies were born during totality? It’s an interesting question because, unlike weddings, you mostly can’t control it, but any baby born during totality will have an amazing story for their entire life. Another guy and I decided to try to estimate it.
We’ll restrict our focus to babies born in the US. I’ll give two solutions: first, the rough estimate we did in the field without looking up any numbers, and second, a more refined estimate using real numbers.
Rough estimate
We essentially want two numbers for the US: $\text{[births per unit (area} \times \text{time)]}$ and $\text{[total eclipse (area} \times \text{time)]}$. We can then multiply these numbers to get an expected total number of births.
First we estimate the area of the US by approximating it as a giant rectangle:
\[\text{[contiguous US area]} \approx 3000 \times 1000 \ \text{mi}^2 = 3 \times 10^6 \ \text{mi}^2\]Then we the estimate the US birth rate by imagining that its entire population refreshes every 100 years:
\[\text{[US birth rate]} \approx \frac{\text{[US population]}}{\text{[human lifespan]}} \approx \frac{3 \times 10^8 \ \text{people}}{100 \ \text{years}} = 3 \times 10^6 \ \frac{\text{people}}{\text{year}}\]We estimate the eclipse path size as a long thin rectangle whose dimensions we’re guessing from memory:
\[\text{[eclipse path size]} \approx 1000 \times 50 \ \text{mi}^2 = 5 \times 10^4 \ \text{mi}^2\]And we use a number for the duration of totality:
\[\text{[eclipse duration]} \approx 10 \ \text{min}\]Finally, combining everything and approximating $\text{1 year} \approx 5 \times 10^5 \ \text{min}$, we find that
\[\begin{aligned} \text{[number of eclipse births]} &\approx \frac{\text{[US birth rate]}}{\text{[contiguous US area]}} \times \text{[eclipse path size]} \times \text{[eclipse duration]} \\ &\approx \frac{3 \times 10^6 \ \text{people / year} \times 5 \times 10^4 \ \text{mi}^2 \times 10 \ \text{min}}{3 \times 10^6 \ \text{mi}^2} \\ &\approx 1 \ \text{person} \ (!!) \end{aligned}\]Astonishingly, everything cancels, and we’re left with a prediction of, on average, one baby born during totality in the United States!
Refined estimate
Alright, let’s see how close our feeder quantities were to the real numbers. Standard references (Wikipedia, the CDC, etc.) tell us that, in reality,
\[\text{[contiguous US area]} \approx 3.1 \times 10^6 \ \text{mi}^2\] \[\text{[US birth rate]} \approx 3.7 \times 10^6 \ \frac{\text{people}}{\text{year}}\]Looking an actual eclipse map, a better estimate for the size of the path of totality seems like
\[\text{[eclipse path size]} \approx 2100 \times 110 \ \text{mi}^2 = 2.31 \times 10^5 \ \text{mi}^2\]While it’s all over the internet that the duration of totality on the centerline of the path was about four minutes, I didn’t readily find any maps that show how that duration falls off as you get closer to the edge of the path. However, the fact that nobody seemed to worry much about being near the centerline suggests that the duration doesn’t fall off too fast — probably slower than linear! Working through the geometry of one circle translating and occluding a second, slightly smaller circle, it seems to me like a plot of duration vs. position traces a semicircle — that is, $\text{[duration]} \propto \sqrt{\text{[path half-width]}^2 - \text{[distance from centerline]}^2}$:1
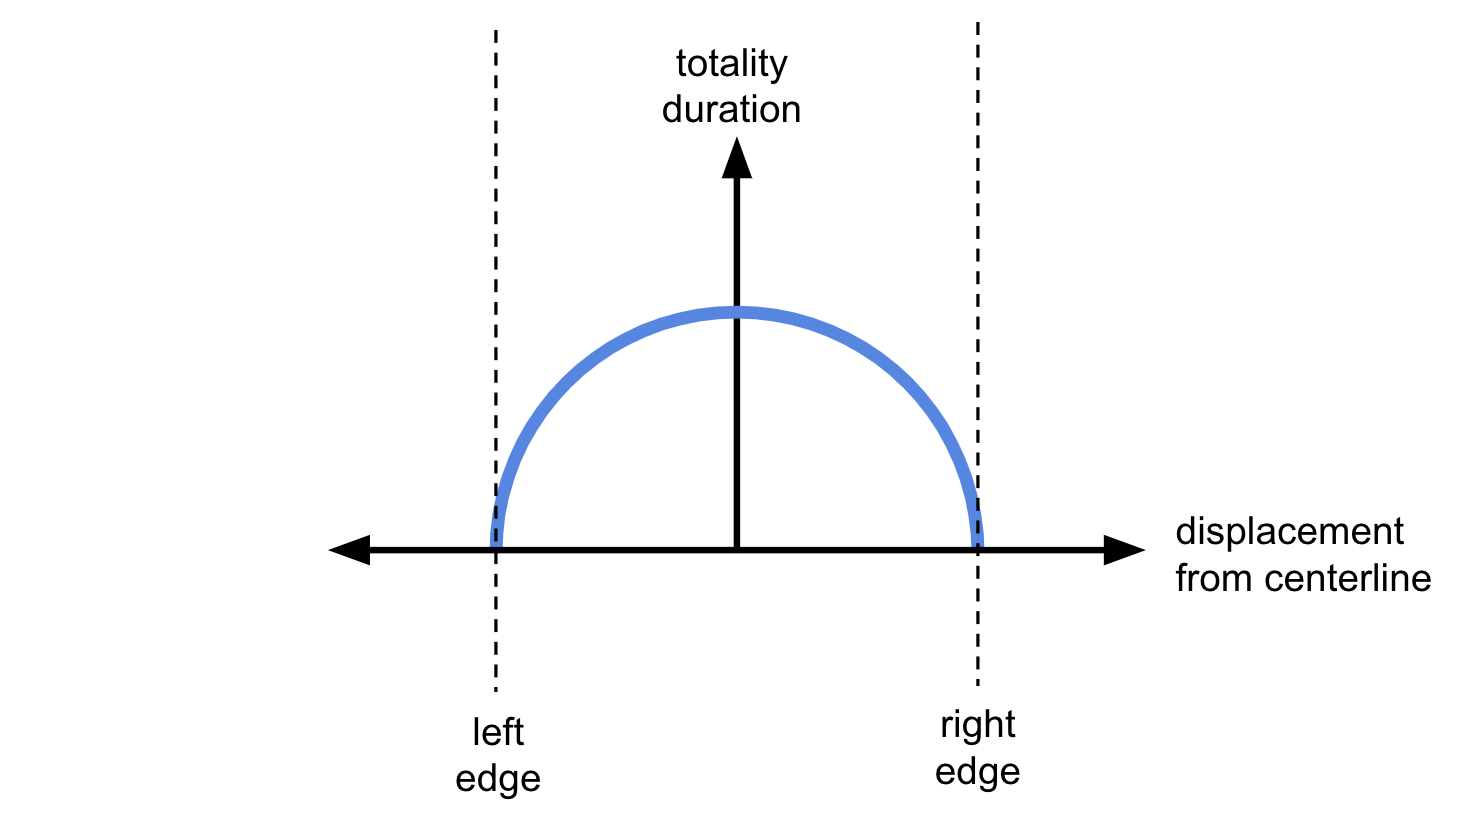
Since the plot here has a steep slope near its edges, you'll get close to maximum duration even if you're close to the edge of the path.
Anyways, the upshot is that, actually, we can just take four minutes as the eclipse duration across the whole path and be mostly correct, and if we want to be more precise, we can average over the path width, which amounts to multiplying by a factor of $\frac{\pi}{4}$.
Putting it all together, we get
\[\begin{aligned} \text{[number of eclipse births]} &\approx \frac{3.7 \times 10^6 \ \text{people / year} \times 2.31 \times 10^5 \ \text{mi}^2 \times 4 \times \frac{\pi}{4} \ \text{min}}{3.1 \times 10^6 \ \text{mi}^2} \\ &\approx 1.6 \ \text{person} \end{aligned}\]So, in light of this better calculation, how’d the rough estimate turn out? Surprisingly, our field estimates of the area and birth rate of the US were really good, and we underestimated the area of the eclipse but overestimated its duration in ways that came close to cancelling, so our refined estimate is just a bit bigger than our original estimate! It always surprises me how often these rough Fermi estimates are quite close to better calculations… I’d be really interested in a paper studying how errors usually accumulate in Fermi calculations to get some intuition for when to expect an accurate result.
So was there actually an eclipse baby?
Googling things related to “eclipse baby” returns this story of a Texas family whose baby was born on the eclipse day. This article says that it was born during the total eclipse, but the birth time they give is about half an hour before totality, and in this interview the parents say they saw the total eclipse after the birth, so it seems this is just a near miss.
The question’s still out, then — was there a baby born during totality in 2024? If you meet this baby, please introduce us.
-
You get this functional form regardless of the relative sizes of the circles! It reduces to the question of whether the center of one circle is within a certain distance of the center of the second circle. ↩